.webp)
Material Uncertainty
"Where the degree of uncertainty in a valuation falls outside of parameters that might normally be reasonable and accepted" - VPGA 10, RICS Red Book
What is material uncertainty?
Valuation Reports and documentation are a critical and defining feature of the Red Book Global Standards process.
A valuation report must clearly and accurately set out the conclusions of the valuation in a manner that is neither ambiguous nor misleading and does not create a false impression.
In times of uncertainty, that would not be reasonable, and the valuer must draw attention and comment on this uncertainty.
Why is it needed?
There are a several situations where a Material Uncertainty clause is required. We have noted a few of these below.
- Lack of Comparable Data - When certain unknown events happen and cause the market to freeze, there is often a lack of immediate comparable data and the clause highlights that the valuation may be based on limited data.
- Transparency in Exceptional Times - The clause highlights that the valuation is prepared in exceptional circumstances where there is not the same degree of certainty.
How we mitigate?
The Real Estate X team worked through the Covid 19 pandemic and helped Clients navigate and make sense of valuation impact. We can use the experience gained during that time and apply it to the advice we continue to give to Banks, financial institutions and stakeholders across the Emirates.
In exceptional times, market experience is of paramount importance.
2025 Landscape
UAE Education Econimics
Although over 90 Private schools have opened in Dubai over the past decade, demand has consistently outpaced supply, with average occupancy levels reaching record highs across premium and branded institutions. This trend reflects Dubai’s structural population growth, driven by its position as a global hub for talent, expatriates, and high-income families, in line with the emirate’s D33 Economic Agenda and KHDA’s long-term strategy to expand access to high-quality private education.
A similar dynamic is evident in Abu Dhabi, albeit with a more measured supply pipeline. Despite fewer school openings, private school enrolments increased by approximately 12.9% in the 2024/25 academic year, highlighting strong underlying demand. This growth aligns with ADEK’s vision to enhance educational quality, diversify curricula offerings, and position Abu Dhabi as a leading destination for premium education as part of its broader economic diversification strategy under Vision 2030
Across the UAE, sustained population inflows, rising household incomes, and government-led initiatives to attract and retain skilled professionals have structurally increased demand for private education. This has translated into higher fee resilience, improved revenue visibility, and stronger operating margins across established school operators. In particular, premium and super-premium segments have seen the most pronounced demand-supply imbalance, supporting fee growth and high utilisation rates.
As a result, investor appetite for education assets has strengthened significantly. The sector is increasingly viewed as a defensive, income-generating asset class, underpinned by stable cash flows and long-term demographic tailwinds.
This has led to increased transactional activity, with over AED 1.3 billion in education-related deals recorded during 2025, alongside a growing pipeline of greenfield developments and land allocations.
Looking ahead, both KHDA and ADEK are actively facilitating further capacity expansion, targeting the delivery of new school seats and campuses in line with projected population growth through 2030 and beyond. However, given the continued pace of demand growth, particularly within mid-to-premium and premium segments, the market is expected to remain undersupplied in the near term, sustaining favourable operating conditions and continued investment momentum across the UAE’s private education sector.
UAE EDUCATION PERFORMANCE
Private School Sales
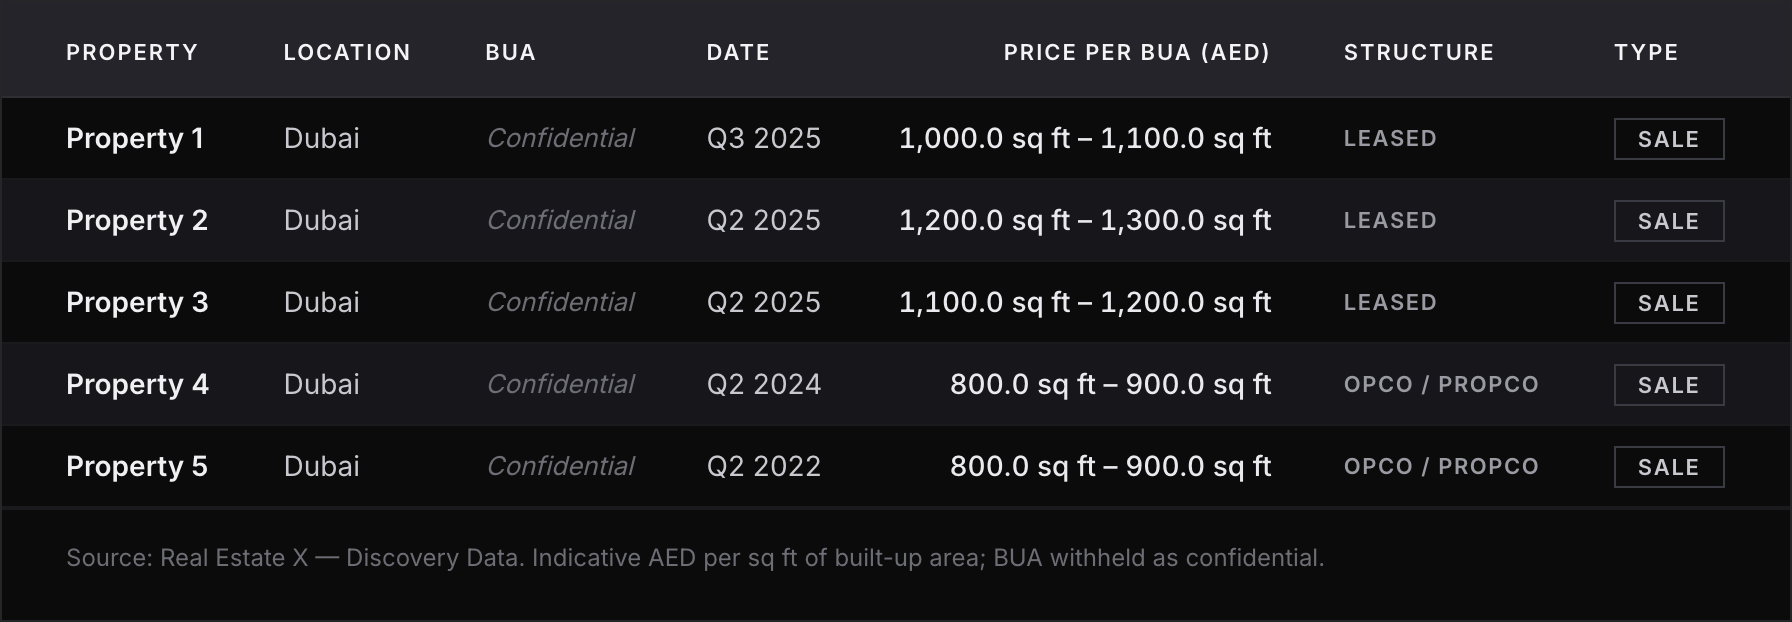
Many of the premium positioned assets have been bought on sale and lease back arrangements’ or purchased with an existing rental agreement in-place. Increased activity for premium positioned assets, in close proximity to established communities continue to be in strong demand.
Private school KPI 2025
Premium private schools in the UAE are delivering strong rental yields, rising capital values, and institutional-grade income characteristics, driven by sustained demand-supply imbalance and positioning the sector as a core alternative real estate asset class.
Current Situation
As of March 2026, the regional escalations in the Middle East have led to precautionary disruptions to education in the UAE, with schools and universities temporarily shifting to
online learning. The disruption led to uncertainty, prompting pupil transfers, teacher departures, and rising staffing and operating costs.
At the same time, the impact has extended to the real estate sector, with heightened geopolitical risk contributing to construction delays, supply chain pressures, and cost spikes for under construction education facilities.
Although tensions have eased, and in-person learning has resumed since 11 May. Schools will close for the summer break early July. During this time uncertainty still exists.
In order to understand the current dynamics, we interviewed education groups operating over 100 private schools across the UAE.
Four key considerations had impacted the groups immediately and provided a consistent theme across the responses:
Initial impact assessment provided the following observations:
Tuition Revenue
Regional escalations led to temporary declines in student numbers across all groups. These reductions were driven by a combination of internal transfers between facilities, students moving to schools outside their group, and some choosing not to return for Term 3. However, many of those who did not initially return have since re-enrolled. For example, one group that reported approximately 330 student withdrawals confirmed that 60 of those students have already returned.
Performance varied by school rating. Outstanding schools experienced minimal disruption, whereas schools rated good or very good saw higher levels of student movement, with initial declines reaching up to 10% in certain cases.
Well-established premium schools with strong reputations are expected to demonstrate greater resilience. In contrast, mid-market schools are likely to face more pronounced impacts, as short- term cost pressures weigh more heavily on profitability. Schools in established catchment areas are expected to maintain relatively stable occupancy levels.
At the time of review, re-registration activity remained subdued, with some providers expressing uncertainty over whether re-registered students would ultimately take up their places. In line with KHDA and ADEK regulations, re-registration refund deadlines are set at 60 days before the start of the academic year in Dubai and 14 days in Abu Dhabi.
Manpower
Among the groups surveyed, teacher turnover linked specifically to the regional escalation ranged from 0.2% to 9.0% of total staff, with higher levels observed in schools with a younger, predominantly Western teaching workforce.
Typically, annual teacher attrition falls between 10% and 15%, meaning most recruitment cycles had already been completed before the escalation. Some individual schools recorded turnover as high as 27% combined.
Resignations since March have largely been backfilled within existing salary bands, often through local recruitment within the UAE. Some providers have chosen not to replace departing staff on a like-for-like basis, instead using this as an opportunity to optimise timetabling or reduce available sections where re-registrations fall below expectations. Several operators have indicated that short-term teacher-related costs could rise by up to 10%.
Cost of Sales
Beyond staffing, costs associated with books, uniforms, teaching materials, and general supplies are expected to increase abnormally for the next academic year. Most operators are currently reporting cost spikes in the range of 7% to 10%.
Construction Costs
Construction costs have also risen significantly, particularly for campuses targeting September openings. In some cases, total project costs have increased by up to 25%.
To protect profitability, many operators have deferred non-essential capital improvements, postponing discretionary upgrades.
Impact Assessment
Determining Impact
Real Estate X are one of the only consultancies to provide and report three valuation methodologies for each educational asset, to assist any client to make an informed decision.
Real estate assets are generally less exposed to short-term volatility than sectors driven by transient demand, such as hospitality. However, they remain influenced by broader economic and socio-political factors, particularly those affecting parental confidence, affordability, and population movements.
The education sector responds to demand shifts differently, as enrolment decisions are typically made on an academic-year cycle rather than in real time. While this provides a degree of stability relative to more reactive sectors, it also means that changes in sentiment, economic conditions, or external disruptions may take longer to materialise, but can result in more sustained impacts on enrolment, fee collection, and overall financial performance.
The UAE education market has benefited from sustained demand growth, driven by increases in the expatriate population, resulting in record enrolment levels. In forming an opinion of value, Real Estate X is among the few consultancies that provides a minimum of three valuation scenarios for each educational asset, supporting informed decision-making.
Accordingly, our reports present sufficient analysis, justification, and transparency to support a robust opinion of value. In contrast, reports that rely solely on a profits-based approach may omit critical supporting analysis for a discounted cash flow (DCF), potentially resulting in conclusions that fall outside the definition of Market Value.
The weighting of valuation methodologies depends on the underlying operational model. For owner-operated assets, the profits method typically underpins the valuation, whereas leased assets are more appropriately assessed using an income capitalisation approach. In the case of leased assets, financial forecasts are primarily used to determine an appropriate level of affordable rent.
The typical valuation workflow looks like this, with each stage cross checked and underpinned by the other:
Income Approach
In examples where the asset is assumed to be operated, in accordance with VPGA 4, the Property is valued as an operational entity. The valuation on this basis therefore includes:
- the legal interest in the land and buildings as a whole;
- the trade inventory, usually comprising all trade fixtures, fittings, furnishings and equipment;
and
- the markets perception of the trading potential, together with an assumed ability to obtain/renew existing licenses, consents, certificates and permits.
But also excludes:
- Any personal goodwill - this is the value of profit generated over and above market expectations that would be extinguished upon sale of the trade related property, together with financial factors related specifically to the current operator of the business.
Key valuation consideration: Providing analysis solely relying upon a profits approach creates a risk of combining property value (PropCo) with business value (OpCo).
The profits method derives value from trading performance, which inherently reflects both the property and the business operating within it and therefore the boundary between tangible and intangible assets can sometimes become blurred.
Although trade-related properties are often sold as part of a going concern and may include both elements of PropCo and OpCo, suitable adjustment should be made on each occasion to provide an opinion of Market Value of the Property.
In-line with RICS and IVS frameworks, separate guidance is prepared for:
- Businesses and Business Interests (IVS 200)
- Intangible Assets (IVS 210)
- Real Property Interests (IVS 400)
In practice, the profits method valuations straddle all three, creating ambiguity about the correct basis of value. In consideration of this key valuation consideration, Real Estate X will always crosscheck the analysis upon this method against an income capitalisation approach and market transactions.
Approach Adjustments
When preparing our forecasts, we have drawn upon historical performance across multiple segments, supplemented by our in-depth market expertise. These inputs provide a robust basis for the following adjustments to Year 1 financial projections, presented on a present value basis. From Year 2 onwards, standard inflationary assumptions are applied.
Enrolment
A modest reduction in enrolment has been assumed, reflecting varying performance across asset types. While certain well-positioned schools are outperforming, we have applied an overall 2% reduction in average annual enrolment to reflect the current uncertainty.
Tuition Fees
In line with regulatory mandates, tuition fees are assumed to remain frozen for the upcoming academic year.
Discounts
Increased competitive pressures, including new market entrants, are expected to drive higher levels of incentives. This includes concessions, sibling discounts, bursaries, and staff incentives, which have been adjusted accordingly.
Ancillary Income
Revenue streams from extracurricular activities (ECA) and facility hire are assumed to remain stable.
Manpower
Payroll assumptions reflect abnormal cost growth in Year 1, subject to the operating model. In certain cases, where there has been a reduction in teaching staff linked to regional disruption, operators may respond by reducing the number of class sections and overall headcount, partially offsetting inflationary pressures associated with new hires.
Cost of Sales
Cost of sales is assumed to experience a short-term spike of approximately 7%–10% in Year 1. This includes items such as books, teaching resources, uniforms, and catering. Treatment of these costs will vary depending on the operating model, particularly in terms of the extent to which they are absorbed by the school versus passed on to parents.
Insurance
Valuation assumptions typically account for property insurance only. Other insurance-related costs are generally captured within tuition fees or administrative expenses. While some operators may elect to take out additional policies, any associated incremental costs have been excluded from this analysis.
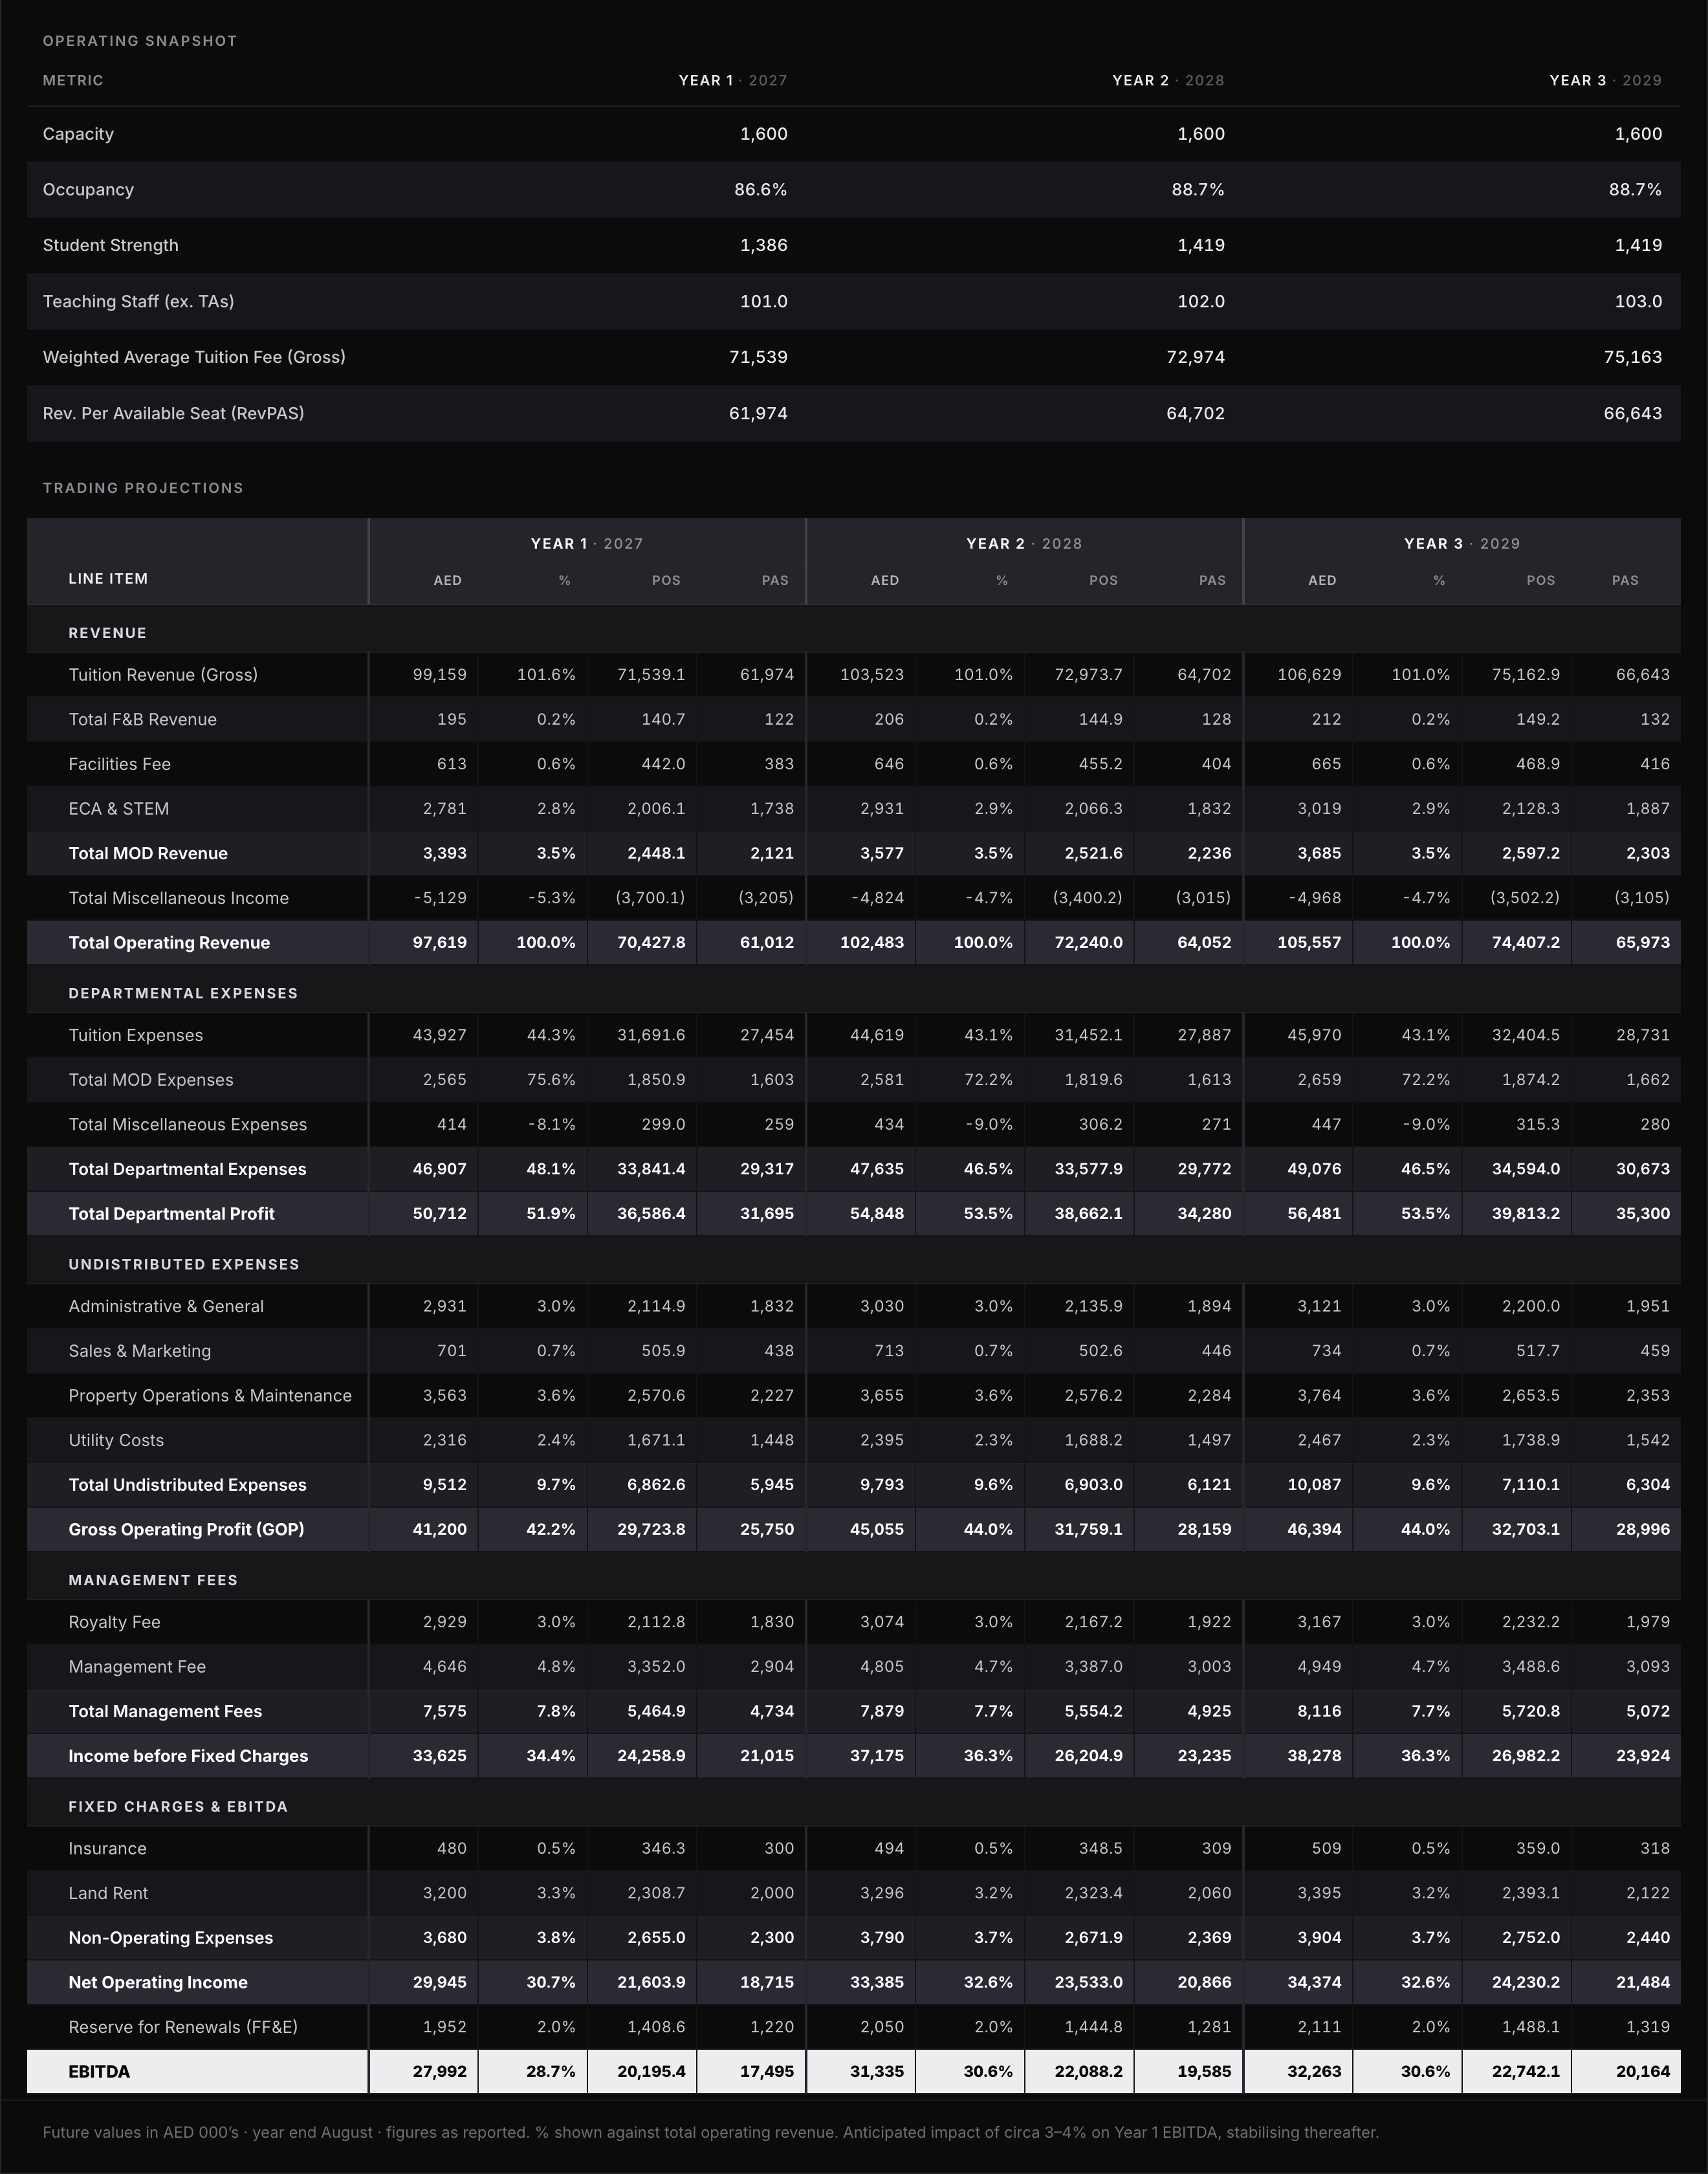
The analysis is presented in the format set out below.
Income Approach
The below replicates what we believe to be a market lead operational forecast from the valuation date (current). For the purposes of the case study, we assumed an established leasehold facility based in Dubai operating as a premium UK Curricula school:
Yield & Discount Selection
When determining a yield, it is important to distinguish between the relevant valuation methodologies. The yield is selected using a base of 7.00%, which currently reflects the return expected by investors for educational assets where affordable rental levels are AED 20m and below. Where affordable rental levels exceed AED 30m, a base yield of 8.00% is typically applied; however, it is noted that the most recent comparable transactions have occurred within a range of 7.50%–7.75%.
It is important to recognise that these yields are considered equivalent yields, given that many leased educational assets include contractual rental escalations. There are cases where contracted rental levels are not fully supported by current operational performance, and in such instances, yields are adjusted to reflect this risk, alongside other relevant variables.
The yield is further refined to differentiate between an income-producing asset, where the yield reflects the risk associated with receiving a pre-determined rental income, and an operational entity, where the capitalised yield inherently includes elements of both an OpCo and PropCo. Evidence supporting yields for operational assets is less transparent, as it requires an understanding of the financial forecasts underpinning transactions.
Based on our understanding of the market, exit yields in the range of 9.00% –10.00% for good- quality freehold assets generally produce outcomes that can be corroborated by alternative valuation methodologies and comparative sales. This compares to yields of approximately 11.00% –12.00% for comparable leasehold assets, particularly where unexpired lease terms are under 50 years.
The discount rate is derived from a base equivalent to the adopted yield plus inflationary growth and is then further adjusted to reflect the operational risk associated with the forecast
assumptions. From an operational perspective, forecasts that stabilise above 80% occupancy typically attract an additional risk premium, as sustaining enrolment levels above this threshold requires consistently strong demand across all year groups throughout the cash flow period. The overall capacity of the facility is also a contributing risk factor.
In the current market, where strong growth has been observed across the education sector, elevated enrolment levels should be treated with caution, as they may stimulate further investment and new supply.
Sensitivity
To assist the reader in understanding the dynamics of a discounted cashflow, Real Estate X uses a proof of value concept and a return analysis to justify any opinion of value.
For a proof of value concept, we convert the financial forecast into an estimate of value by applying market debt and equity ratios to confirm the results produced. The aim is to assess whether the determined cashflow can in turn satisfy a market lead financing structure and sustain mortgage and equity returns. In addition, the model will determine to what extent the forecasts provide a ‘supportable value’.
To take this a step further, from analysis of the forecasted cash flow, it is helpful to analyse the weighting of total value between the forecasted cash flow and the present value of the terminal value.
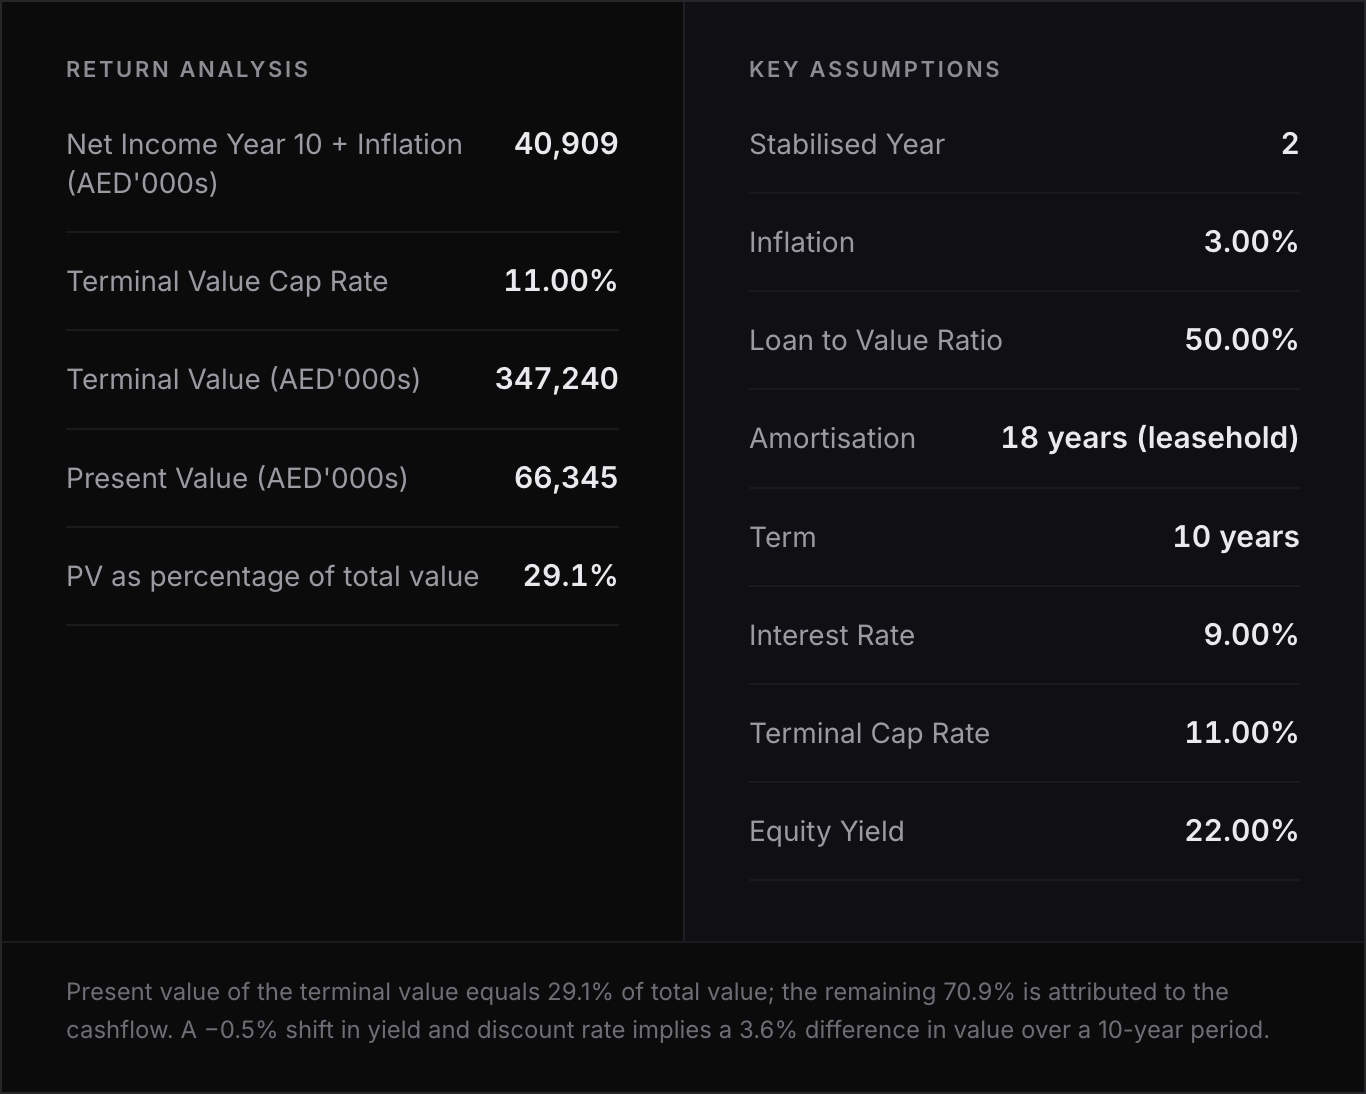
Using our Base Scenario, the present-day value of the terminal value is equal to 29.1% of the total value, this in-turn suggests 70.9% of the total value is attributed to the cashflow.
This 70.9% is split over the 10-year forecast and due to discounting Y1 provides for 16.0% of the total value attributed to the cashflow. Alternatively, this represents 11.3% of the total value, which suggest that if the facility were only able to break even during the first year of analysis, we would expect a circa 10% impact on value vs. normalised conditions.
Note: this scenario is specific to a leasehold asset, likened to the case study
Income Approach
After providing an analysis of the expected performance of the asset, we then try to establish an opinion of value using an income capitalisation approach. This is a necessary step in determining an opinion of Market Value and one that provides substantial weighting to the valuation as a whole.
Examples of rental evidence we detail within our reports are provided, the below has been simplified for the purposes of this paper:
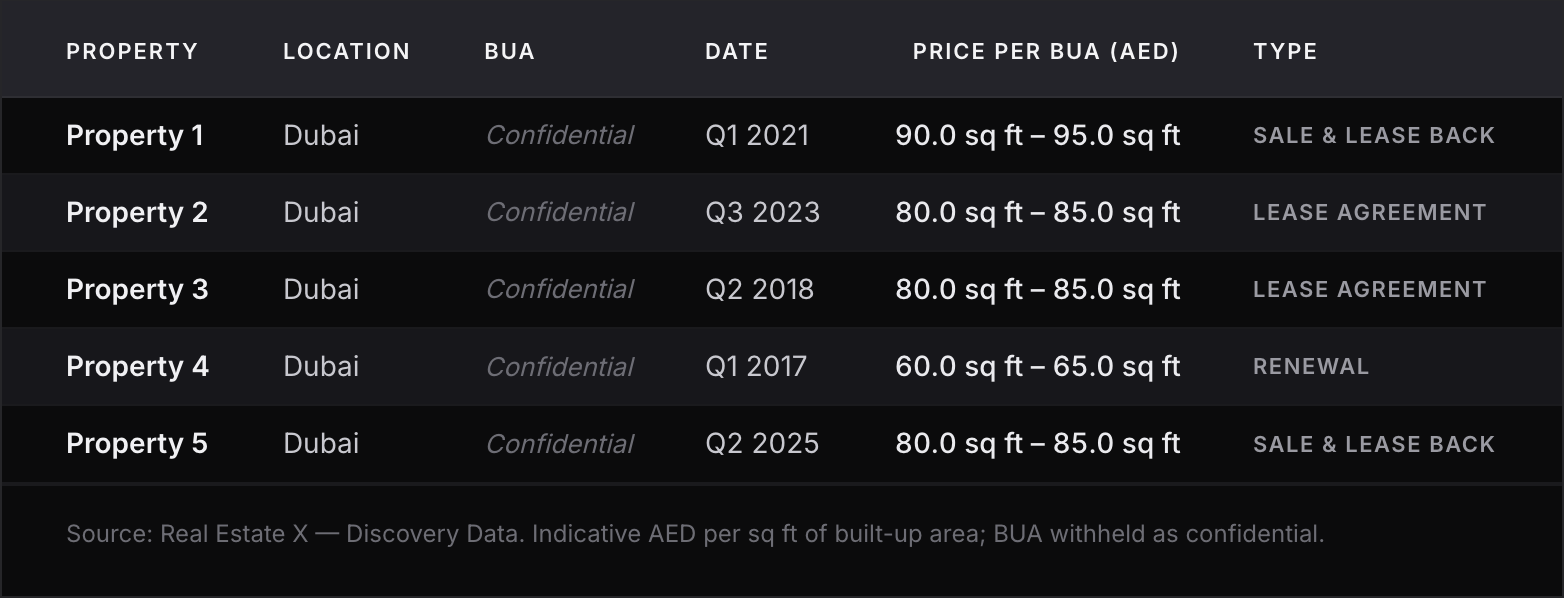
We rely on comparable lease transactions, applying our market experience to make appropriate adjustments, and supplement this analysis with industry benchmarks when assessing affordable rent. This is further cross-checked against the profits approach. Industry standards are then used to evaluate whether the proposed rent is sustainable under normalised trading conditions.
An example is shown below, cross checked against KPIs such as percentage of turnover or EBITDA to ensure returns to the lessee and rent cover are all within a reasonable parameters:
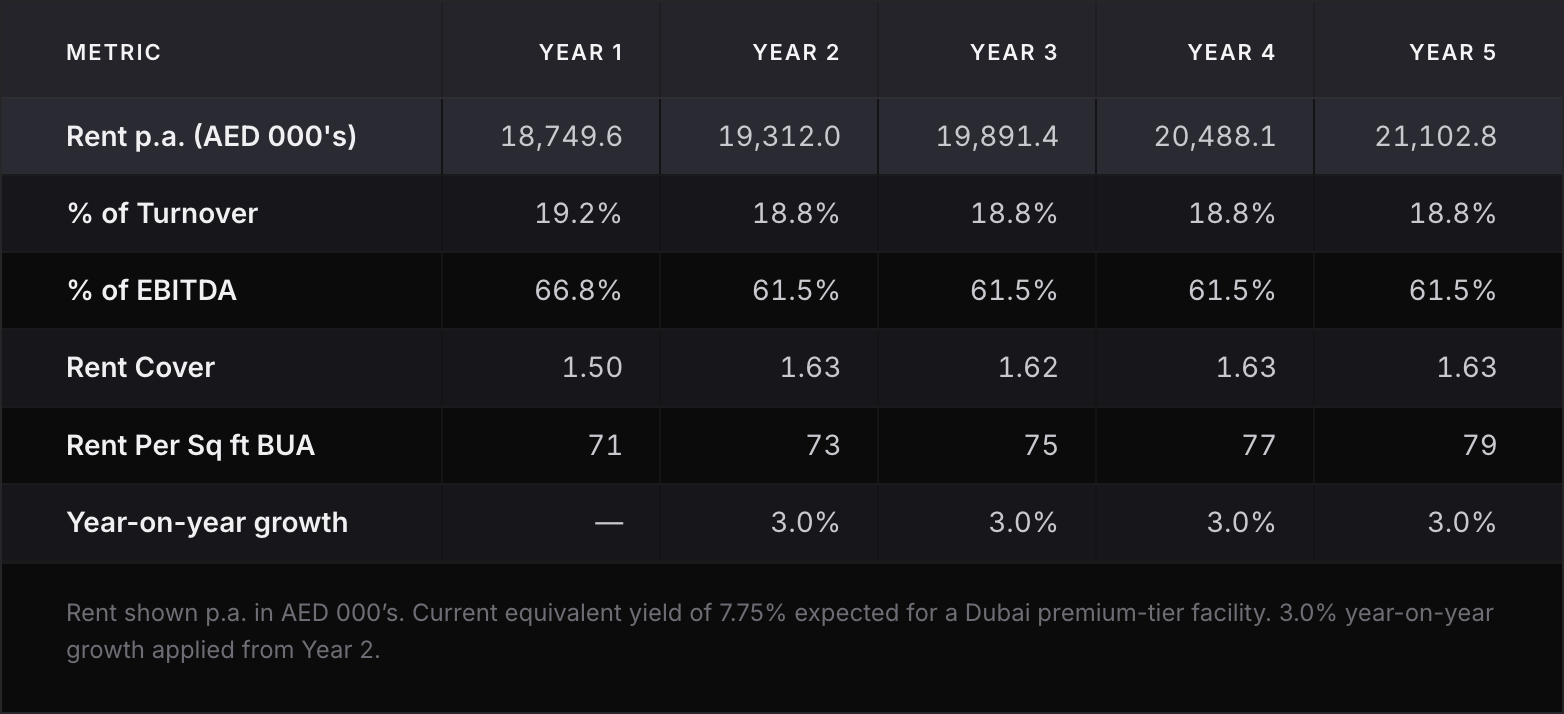
Depending on the operational model, rent is then put through an inflated cashflow, in-line with known newly negotiated lease transactions or capitalised on an equivalent yield basis given most long-lease terms associated with educational facilities and most recently agreed contain rental escalations which need to be factored.
Market Approach
The third approach is a market approach. Given the nature of transactions and that no two assets are the same, it cannot be used as a primary method of valuation, rather a sense check against the previous two.
Examples of sales evidence we detail within our reports are provided, the below has again been simplified for the purposes of this paper.
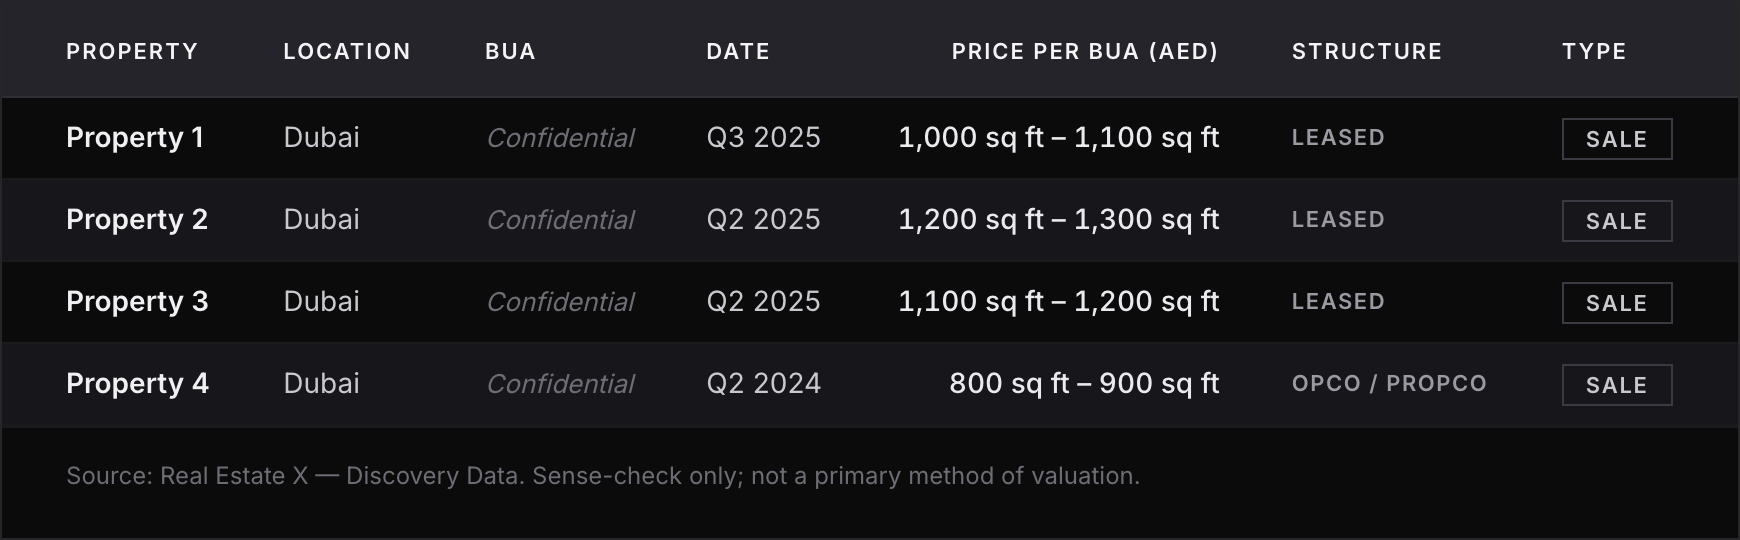
We use known sales transactions, using market experience apply necessary adjustments using the following attributes:
- Location
- Date of transaction
- Type of information (sale, offer, negotiation)
- Performance (yield)
- Lot size
- Tenure
- Facilities
- Brand
If the results from the previous two valuation methods are far from comparable transactions, assumptions adopted maybe re-looked at in order to qualify the reasonableness.
Cost of Entry
The cost of entry into the market must be considered and is a final check. In our case study, the land is held under a leasehold basis, a capitalisation of existing ground rent levels or an adjustment between freehold sales and leasehold considerations can be applied.
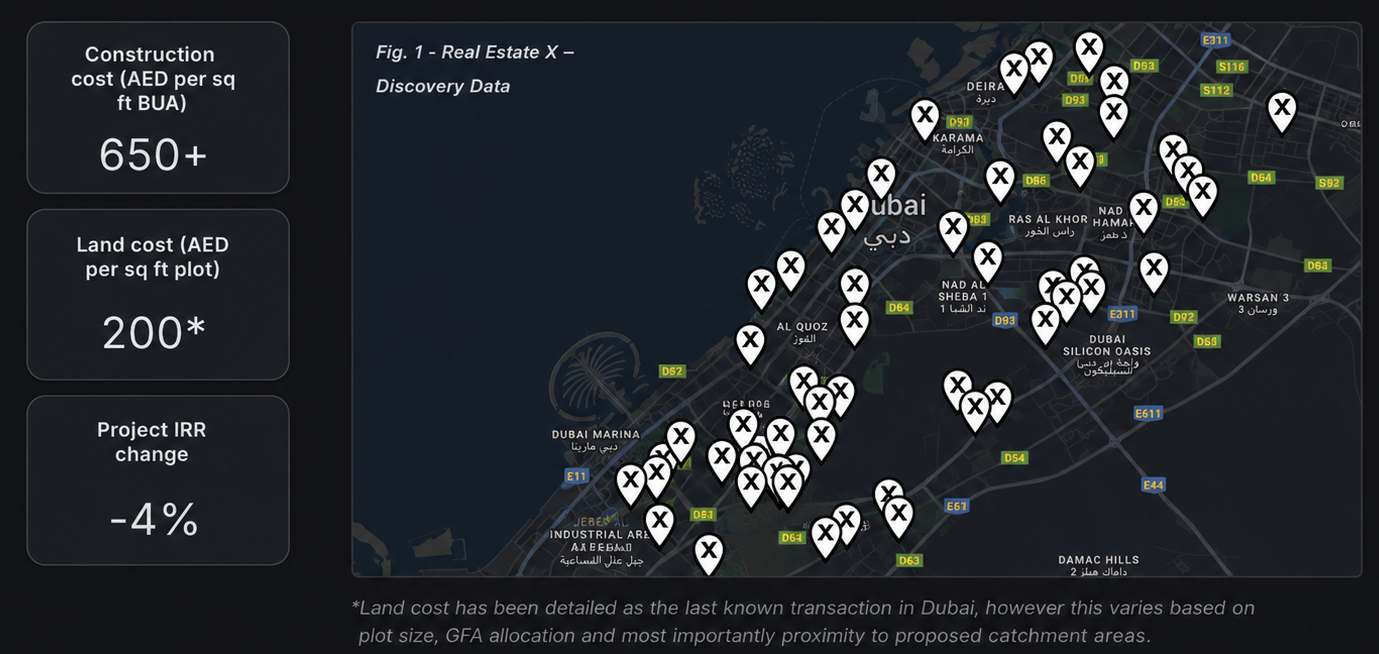
With recent construction cost tenders for schools ranging from AED 600 – 800 per sq ft on the proposed Built-Up Area, for premium positioned campuses. Schools looking to open doors for the next academic year are currently seeing an average of 25% increase in cost, although these cost spikes are expected to normalise, typically the spikes are not as quick on the way down. We expect construction costs to continue to be elevated in the short-term.
This poses development viability issues with IRR shifts on average of 3 – 4%, for schools which were looking at mid 20% project IRR, or 15% leveraged IRR. Potentially causing a barrier of entry in the medium term for future supply.
Although mid-fee tier schools may not generate as strong a development IRR on a standalone basis, they often form a necessary component of an education group’s portfolio. Groups typically include these assets to ensure accessibility across a broader range of curricula and fee levels, supporting a more balanced and inclusive offering.
Real Estate X is tracking transaction evidence specific to educational assets (Fig. 1) and utilises this information when providing valuation advice. A snapshot of information we are privy to is shown below:
Valuation Results
The analysis contained throughout the information paper provides the following adjustments from a base scenario which assumes zero impact for regional disruption:
The analysis has been undertaken with reference to a premium-tier, Dubai-based educational facility following a UK curriculum. Further adjustments would be required when considering mid-tier facilities or alternative curricula.
In isolation, a profits-based approach may indicate that even the segments least impacted by the regional escalation would have experienced a marginal decline in value; however, this effect is operational in nature.
When valuing an educational asset, the primary focus is typically on the underlying property value rather than operational performance. Current operational performance remains within accepted industry benchmarks for affordable rent, namely 18 – 20% of total revenue at full capacity utilisation, or 15 – 18% at stabilised long-term occupancy levels. There is no evidence to suggest that these levels are currently being adversely affected.
Although no known transactions involving educational facilities have been recorded since the regional escalation, the analysis within this report indicates that, provided the situation remains temporary, there has been no material change in long-term market sentiment. Accordingly, the pricing expectations of market participants for the acquisition or disposal of such assets remain stable, with underlying fundamentals remaining strong.
Short-term increases in construction costs, along with a shortage of land zoned for educational use, have already driven up barriers to market entry. This is likely to have a positive impact on the capital values of existing facilities going forward.
Summary
The Real Estate X team have valued assets through two market cycles, through political unrest, the Covid 19 pandemic and now the latest Gulf conflict
- The fundamentals of education valuation remain unchanged, with primary emphasis placed on distinguishing between OpCo and PropCo components and determining a Reasonably Efficient Operator (REO) value under a hypothetical transfer scenario.
- Transactional activity is expected to continue broadly in line with historical norms.
- While fee freezes are likely to place additional pressure on operating margins, long- term projections remain strong.
- Demand for premium schools continues to be robust; however, mid-tier and lower-fee institutions are more exposed to cost pressures, where relatively small movements in fixed and variable costs can have a disproportionate impact on EBITDA. In such cases, proactive lender support, through short-term flexibility in loan terms, can help preserve operational continuity, protect long-term asset values, and mitigate the risk of distressed disposals.
- Education valuations are complex, with a strong emphasis on future receivables. Supporting valuation methodologies are essential and provide suitable risk profiling against short-term fluctuations in enrolment levels or EBITDA margins. Consequently, even material changes in enrolment or cost profiles are unlikely to have a disproportionate impact on overall market values.


Explore Our Latest Insights
This blog explores the importance of surrounding yourself with like-minded individuals, mentors, and networks that can provide guidance, encouragement